Week 7 Maximum Likelihood II, July 12th
There are a couple of concepts related to maximum likelihood estimation for which one can gain an intuition after understanding how maximum likelihood works.
7.1 Score Function
The score is defined as the gradient (think first derivative) of the log-likelihood with respect to the parameters of a model.
We have established earlier that the likelihood function for the parameter p in a binomial distribution can be expressed as
\[\mathcal{L}(p) = {n \choose k} \cdot p^k \cdot (1-p)^{n-k}\]
With the corresponding log-likelihood being
\[log(\mathcal{L}(p)) = log {n \choose k} + k(log(p)) + (n-k)log(1-p)\] We can now obtain the score function s for the parameter p in respect to k, the number of successes and n, the number of observations through calculating the derivative of the log-likelihood with respect to p
\[s = k/p + (-1)(n-k)/(1-p)\] which we can re-write to
\[s = k-pn\]
7.2 Fisher Information
Now, the score function is mainly used for obtaining the Fisher information, of a given random variable \(X\) for a model parameter \(\theta\). The Fisher information is simply the variance of the score function of the log-likelihood of \(\theta\) with respect to \(X\). Gaining an intuition of what the Fisher information means, however, is much more interesting than this plain definition.
In the example of the binomial distribution, we might ask how informative n observations are for any parameter value p. Note that p in this case is the “true” p we are trying to estimate. We can show that the variance of the score function, or Fisher information, in this case, equals
\[var(s) = \frac{n}{p(1-p)}\]
Let’s plot the Fisher information for an n of 5 observations each for different estimations of p.
curve(5/(p*(1-p)), xname="p", from=0, to=1, ylab="var(s) for n=5")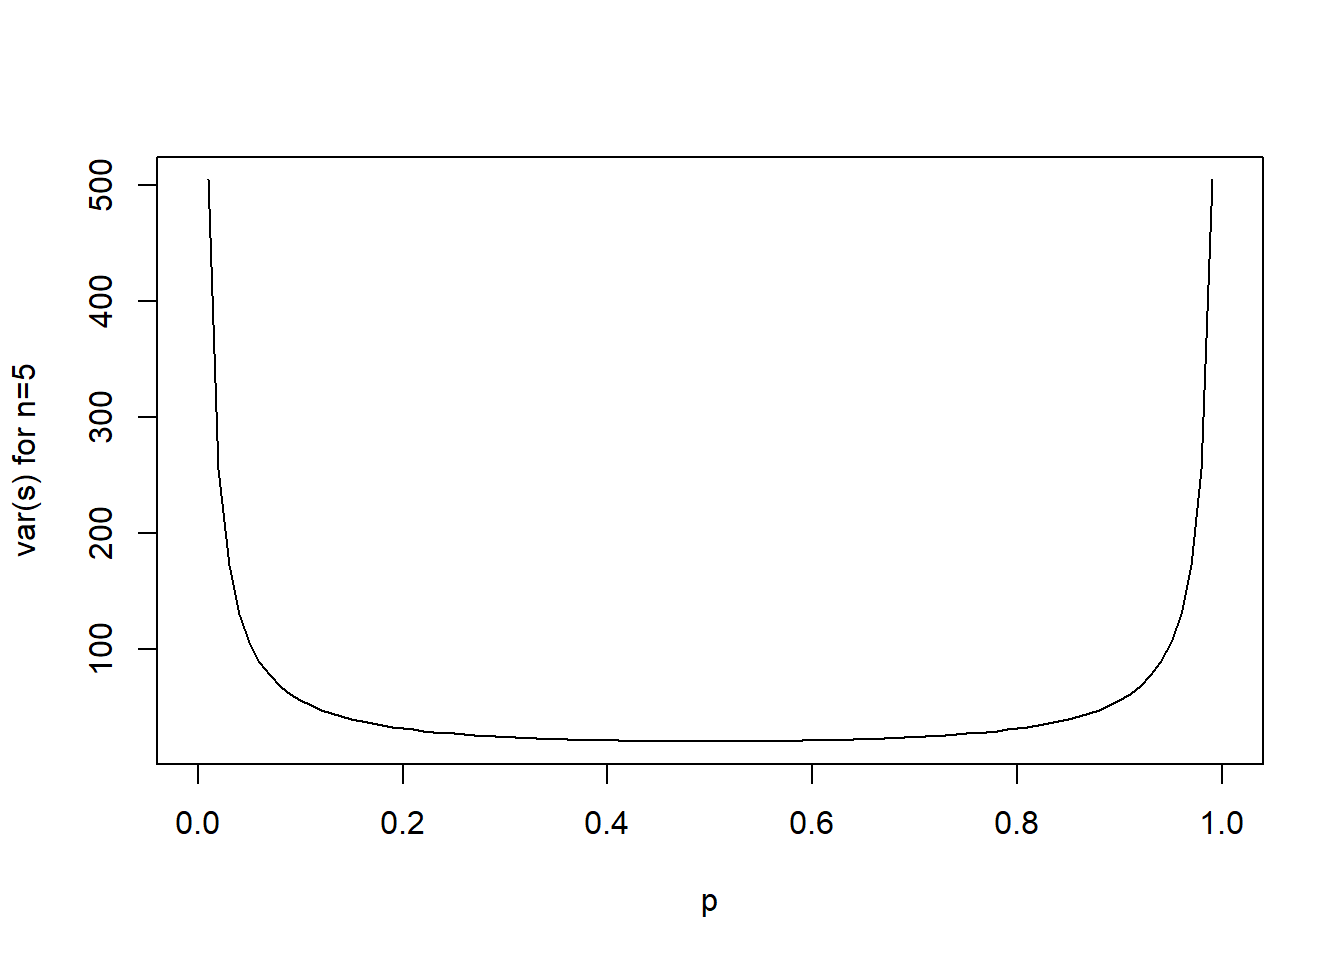
This graphic shows that the informativity for data collected from a binomial distribution increases for extreme values of p. you could interpret the informativity as the degree to which the data is informative for estimating the parameter p. Another way of describing this is that the informativity of an estimator is inverse to its variance. you can imagine that an estimator with huge variance is not really accurate (or informative) in estimating a parameter. As you can see through the formula \(var(s) = \frac{n}{p(1-p)}\), the informativity of the data increases with n, but is also generally higher for more extreme values of p.
There are other instances where the Fisher information has other interesting properties. In the context of the Rasch model, a model which assumes the skill of students and the difficulty of a task in a test to be on one continuous spectrum, the statistical information for estimating the skill of a student is particularly high when the difficulty of the task is close to the skill of the student. This is intuitive when considering that a task that is particularly easy or difficult for a student might not really be informative about the skill of that student.